
{"time":1757500350309,"blocks":[{"id":"jIo5gJfe-U","type":"header","data":{"text":"Shared metrics views ","level":2}}],"version":"2.26.5"}
{"time":1757500350309,"blocks":[{"id":"MZTQwb0Ai7","type":"image","data":{"file":{"url":"https://d34zu6t0zlvykw.cloudfront.net/post/shared-metrics-view.png"},"caption":"","withBorder":false,"stretched":false,"withBackground":false}},{"id":"RDTc06V726","type":"paragraph","data":{"text":"Sharing journeys should bring teams together — but until now, metrics often looked different depending on who was viewing them. Time frames and intervals weren’t consistent, making collaboration frustrating."}},{"
What's new
Shared metrics views
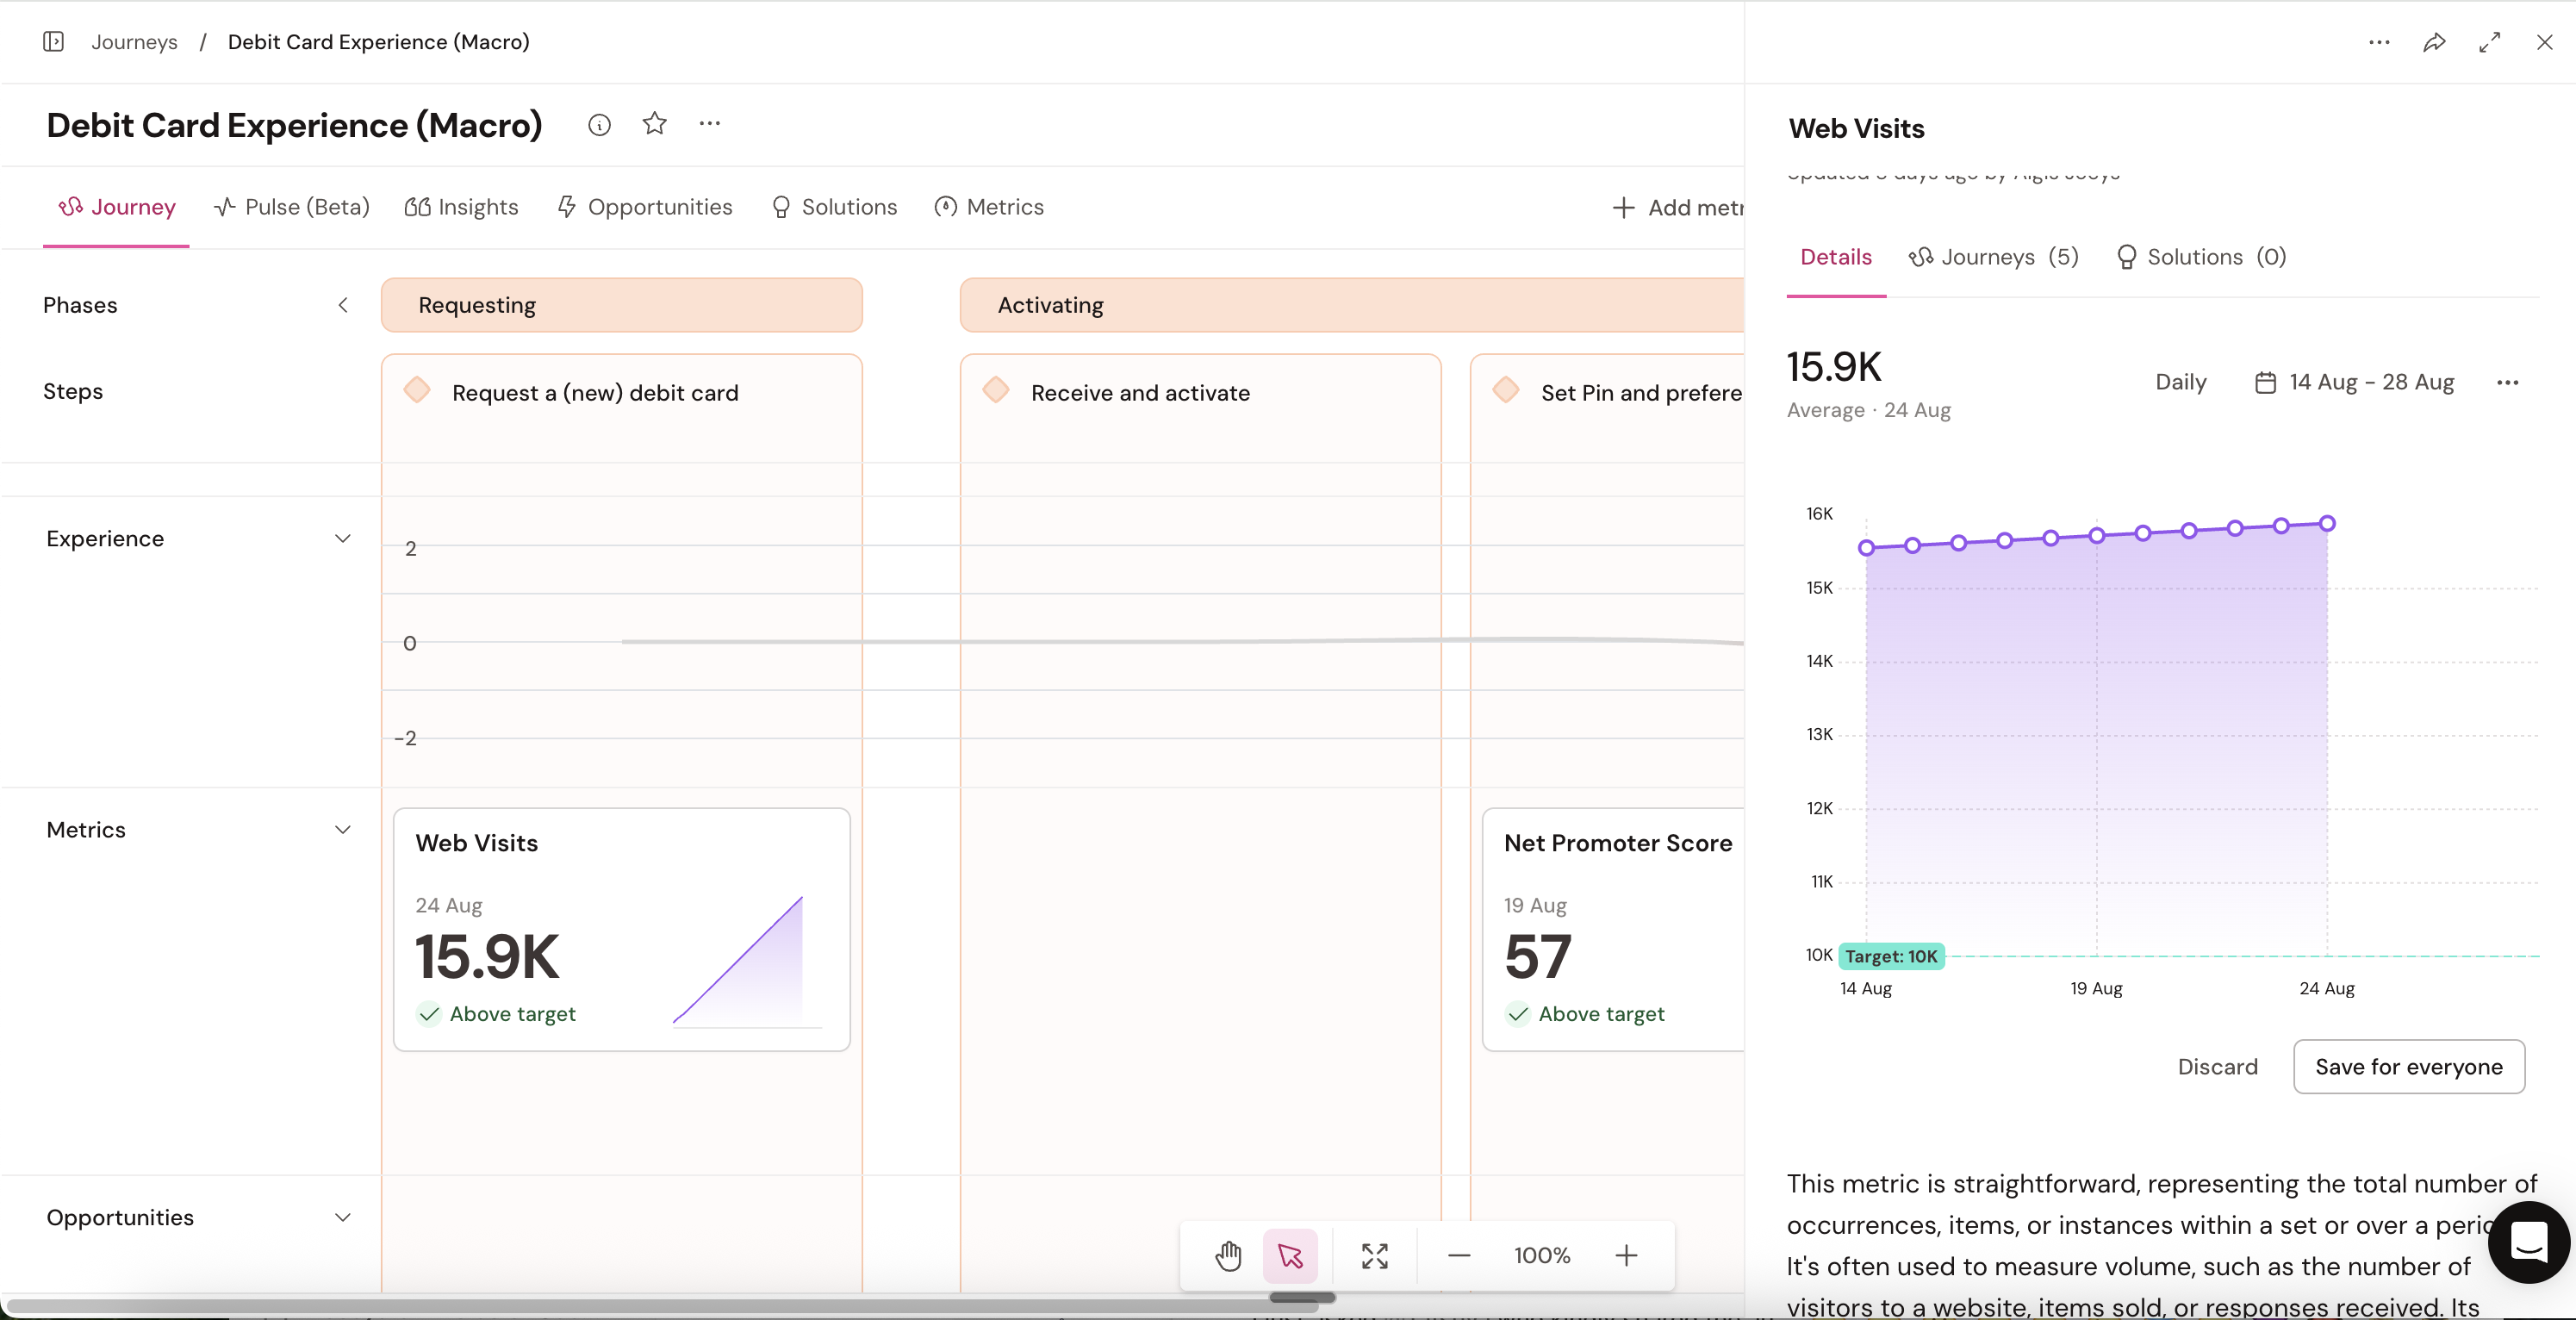
Sharing journeys should bring teams together — but until now, metrics often looked different depending on who was viewing them. Time frames and intervals weren’t consistent, making collaboration frustrating.
That’s changing. 🎉 We're introducing two new actions right inside the metric card:
• Save for everyone → Align your team with a shared view of metrics.
• Discard → Explore and experiment on your own without changing what others see.
Now, you get the best of both worlds: the freedom to analyze metrics your way, and the power to lock in a consistent view when it matters most. Collaboration just got a whole lot smoother, right?
🍿 Check it out and let us know what you think.